Wednesday, March 27, 2013

Structure as a graph


> # Assignment 1: Create 3 vectors, x, y, z and choose any random values for them, ensuring they are of equal length,T<- cbind(x,y,z)
> #Create 3 dimensional plot of the same
> sample<-rnorm(50,25,6)
> sample
 [1] 23.10381 25.85777 22.04959 43.53180 12.11174 37.23922 38.92648 22.77181 17.80844 30.41365 32.32586 37.09651 24.55097 19.85470 31.01534 29.70007 31.72610 22.26199
[19] 19.85826 36.94503 23.50247 18.00116 24.50004 27.57822 20.34054 17.32243 30.26892 19.03535 16.14514 28.81016 29.45099 23.10639 25.49178 35.95906 19.35419 23.04064
[37] 25.20819 18.83031 30.75433 19.14759 28.11077 25.91251 28.03618 33.34057 30.19792 25.07813 25.08856 26.12123 24.15002 22.09888
> x<-sample(sample,10)
> y<-sample(sample,10)
> z<-sample(sample,10)
> x
 [1] 22.77181 31.01534 27.57822 22.09888 24.15002 19.85826 28.03618 17.32243 31.72610 19.35419
> y
 [1] 19.85826 26.12123 30.19792 23.10639 31.72610 22.04959 24.55097 27.57822 28.03618 31.01534
> z
 [1] 28.11077 31.72610 28.81016 12.11174 30.41365 23.50247 24.55097 22.04959 29.45099 30.26892
> T<-cbind(x,y,z)
> T
             x        y        z
 [1,] 22.77181 19.85826 28.11077
 [2,] 31.01534 26.12123 31.72610
 [3,] 27.57822 30.19792 28.81016
 [4,] 22.09888 23.10639 12.11174
 [5,] 24.15002 31.72610 30.41365
 [6,] 19.85826 22.04959 23.50247
 [7,] 28.03618 24.55097 24.55097
 [8,] 17.32243 27.57822 22.04959
 [9,] 31.72610 28.03618 29.45099
[10,] 19.35419 31.01534 30.26892
> plot3d(T)
plot3d(T,col=rainbow(1000))
plot3d(T,col=rainbow(1000),type='s')
 > #Assignment no 2: Create 2 random variables Create 3 plots:
> #1. X-Y ,X-Y|Z (introducing a variable z and cbind it to x and y with 5 diff categories)
> x<-rnorm(1500,100,10)
> y<-rnorm(1500,85,5)
> z1<-sample(letters,5)
> z2<-sample(z1,1500,replace=TRUE)
> z<-as.factor(z2)
> t<-cbind(x,y,z)
> qplot(x,y)
qplot(x,z)

qplot(x,z,alpha=I(1/10))
qplot(x,y,geom=c("point","smooth"))
 qplot(x,y,colour=z)
qplot(log(x),log(y),colour=z)


Thursday, March 21, 2013

Analyze your Finance

ReadyRatios Financial Analysis

ReadyRatios is a program (web service, SaaS) intended to carry out an intellectual analysis of a company’s financial position based on data from its financial statements.
The main feature of the system is that individuals should not take part in the analysis. All that has to be done is to enter the data of financial statements (prepared according to the IFRS or US GAAP) and to receive the results of the analysis, which does not differ from the analysis made by a professional analyst.

Software features:


Knowledge of financial analysis is not required:

  ReadyRatios makes all analytical jobs, beginning from the moment when the user enters the data, and finishing when the analytical report is ready.

Highly usable web-interface:

  The program is based on web-technologies and can be opened with the help of your favourite browser. It is supported with the following browsers: Internet Explorer 6+, Firefox 3+, Google Chrome 7+ and Opera 9+.


The program provides the user with a complete report

  Calculate over 40 coefficients and rates, but also to describe the calculated results, to make conclusions and to give an opinion on the financial state of a company. When analysing, the program uses unique scoring methods.


Multiple choice conditional texts

  Multiple choice conditional texts make each report unique. The texts of reports are never repeated, even if the reports are made based on the same data (the probability of repetition is close to zero).


Analysis of reports in dynamics for several periods

  Can get an analysis report for both one reporting period and also for several periods (annually, biannually, quarterly or monthly).


Flexible approach to making tables

  Do not have to glue together pages with tables any more when analysing data over many years. The program has a feature which allows reducing wide tables without significant loss of their informational value.


It is easy and convenient to enter the initial data

  When data is entered into the form, they are given in a financial report. Preliminary or additional calculations are not required .


Information can be saved on the data base

  The user can save the initial data and prepared reports both on their computer and on the server of ReadyRatios. The last variant provides you with fast and convenient access to information for further analysis. To use this feature, the user should log in to the web-site of ReadyRatios .


Great opportunities for professionals

  Want to set parameters of the analysis according to your requirements, you can easily:
  • change any formula or add your own
  • change qualitative properties of the rate (i.e. range of satisfactory and unsatisfactory values), including ones for different industries
  • set a report template (add or remove desirable or undesirable rates)
The program takes into account the settings given by the user, but keeps the analysis absolutely autonomous at the same time.


User report settings

  The user can limit the report and leave only the required sections, select parameters on displaying tables and text, as well as a set level of criticism. Setting a criticism level can eliminate critical remarks and comments in the report text (if the financial state of the company is poor). At the same time informative values and conclusions will not be affected.

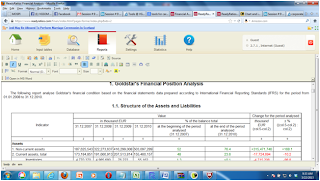
Some screen shots are as follows:


Thursday, March 14, 2013

Panel Data Analysis

Panel data analysis of "produc" data using three models
1.Pooled
2.Fixed
3.Random
Analyzing which model is best suited:
       pFtest : for determining between fixed and pooled
       plmtest : for determining between pooled and random
       phtest: for determining between random and fixed

Commands:
Loading data:
> data(Produc , package ="plm")
> head(Produc)


Pooled Affect Model

> pool <- plm(log(pcap)~ log(hwy) + log(water) + log(util) + log(pc) + log(gsp) + log(emp) + log(unemp) , data =Produc, model=("pooling"), index = c("state","year"))
> summary(pool)


Fixed Affect Model:
 
> fixed <- plm(log(pcap)~ log(hwy) + log(water) + log(util) + log(pc) + log(gsp) + log(emp) + log(unemp) , data =Produc, model=("within"), index = c("state","year"))
> summary(fixed)


Random Affect Model:
> random <- plm(log(pcap)~ log(hwy) + log(water) + log(util) + log(pc) + log(gsp) + log(emp) + log(unemp) , data =Produc, model=("random"), index = c("state","year"))
> summary(random)


Comparison
 
The comparison between the models would be a Hypothesis testing based on the following concept:
 
H0: Null Hypothesis: the individual index and time based params are all zero
H1: Alternate Hypothesis: atleast one of the index and time based params is non zero

Pooled vs Fixed
 
Null Hypothesis: Pooled Affect Model
Alternate Hypothesis : Fixed Affect Model
 
Command:
> pFtest(fixed,pool)
Result:
data:  log(pcap) ~ log(hwy) + log(water) + log(util) + log(pc) + log(gsp) +      log(emp) + log(unemp)
F = 56.6361, df1 = 47, df2 = 761, p-value < 2.2e-16
alternative hypothesis: significant effects
Since the p value is negligible so we reject the Null Hypothesis and hence Alternate hypothesis is accepted which is to accept Fixed Affect Model.
 
Pooled vs Random
 
Null Hypothesis: Pooled Affect Model
Alternate Hypothesis: Random Affect Model
 
Command :
> plmtest(pool)
 
Result:
 
        Lagrange Multiplier Test - (Honda)
data:  log(pcap) ~ log(hwy) + log(water) + log(util) + log(pc) + log(gsp) +      log(emp) + log(unemp)
normal = 57.1686, p-value < 2.2e-16
alternative hypothesis: significant effects
 
Since the p value is negligible so we reject the Null Hypothesis and hence Alternate hypothesis is accepted which is to accept Random Affect Model.
 
 
Random vs Fixed
 
Null Hypothesis: No Correlation . Random Affect Model
Alternate Hypothesis: Fixed Affect Model
 
Command:
 > phtest(fixed,random)
 
Result:
 
        Hausman Test
data:  log(pcap) ~ log(hwy) + log(water) + log(util) + log(pc) + log(gsp) +      log(emp) + log(unemp)
chisq = 93.546, df = 7, p-value < 2.2e-16
alternative hypothesis: one model is inconsistent
 
Since the p value is negligible so we reject the Null Hypothesis and hence Alternate hypothesis is accepted which is to accept Fixed Affect Model.
Conclusion:
Hence the Fixed model is most suited for panel data analysis of the data"Produc".